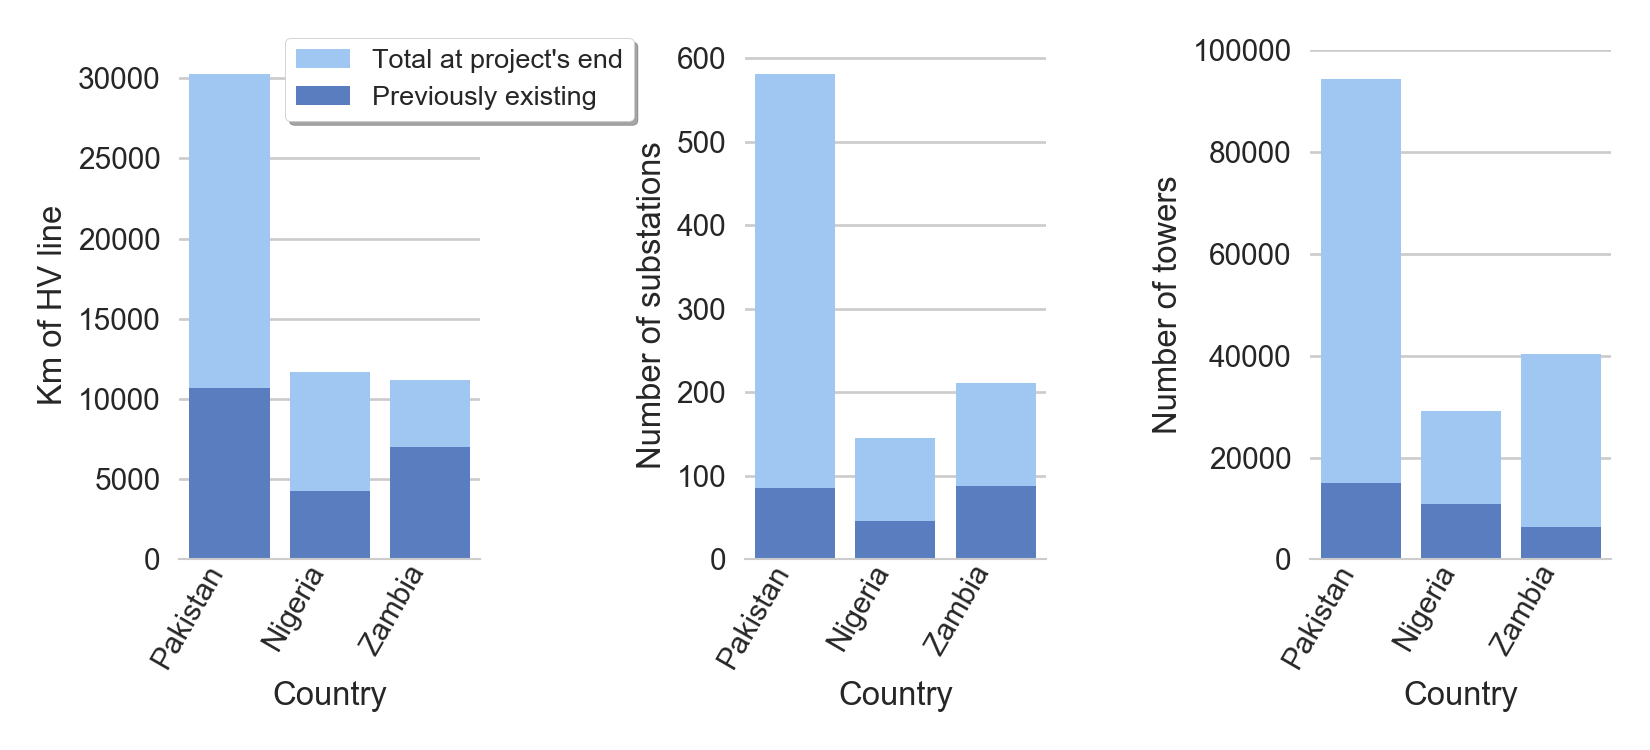
This project substantially expanded the amount of mapped HV infrastructure (Figure 16). Edits include both additions and major corrections though the majority of edits were additions.
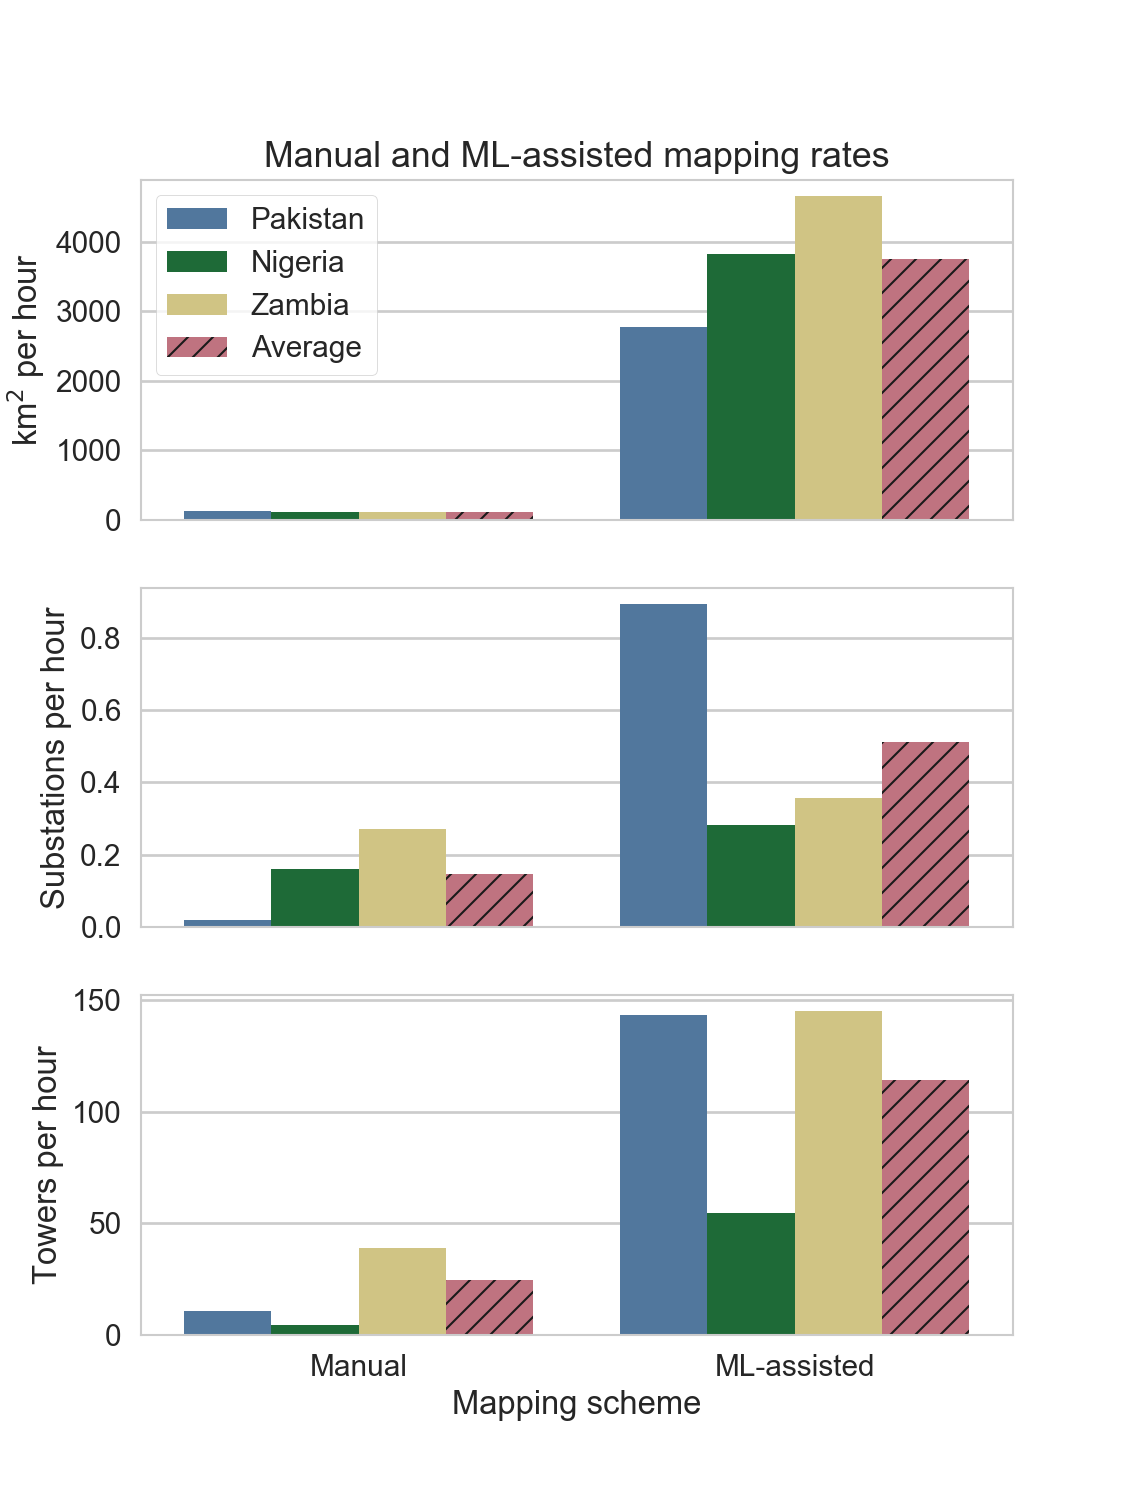
We found that our Data Team was approximately 33.4x faster per km2 with the ML-derived overlay for Pakistan, Nigeria, and Zambia (Figure 17). The total time spent mapping and validating each country using these ML predictions is in Table 1.
Figures 18-20 show before and after maps of every country. Click on each to interact.
Figure 16. HV infrastructure features in OSM. Left: Total length of HV line at the conclusion of this project. Middle: Total number of HV towers at the conclusion of this project. Right: Total number of substations at the conclusion of this project. The bars in all plot are split into the amount of previously existing HV infrastructure (dark blue) and infrastructure added or edited during this project (light blue). In all cases, the large majority of edits were additions.Figure 17. Mapping rate with and without ML-assist. On average, km2 per hour increased by 33.4x, substations per hour by 15.9x, and towers per hour by 9.7. Note that these figures exclude hours spent validating (i.e., double-checking) edits and hours cross-checking WB records. This ensured a fair comparison as no double-checking was carried out during the pre-ML mapping work to generate the training data.
Table 1. Total person-hours spent mapping at country-wide scale.
Country
Hours mapping
Hours validating edits
Hours cross-checking WB records
Total hours
Pakistan
364.13
181.09
85.08
630.30
Nigeria
243.12
74.47
25.25
342.84
Zambia
167.17
29.45
28.70
225.32
Interactive demonstrations
Figure 18. Before and after mapping in Pakistan. High-voltage infrastructure before (yellow) and after (green) this project was complete. Click for interactive demo and zoom in to see individual towers (dots) and substations.Figure 19. Before and after mapping in Nigeria. High-voltage infrastructure before (yellow) and after (green) this project was complete. Click for interactive demo and zoom in to see individual towers (dots) and substations.Figure 20. Before and after mapping in Zambia. High-voltage infrastructure before (yellow) and after (green) this project was complete. Click for interactive demo and zoom in to see individual towers (dots) and substations.