Methods
Nightlight trends
Remote sensing of night-time lights (referred to herein as nightlight) has long been used as a proxy for various human impact indicators, e.g. economic development, electricity consumption, and electricity reliability. DMSP-OLS, launched in 1992, was the only large-scale nightlight dataset available until the launch of the SNPP-VIIRS (VIIRS) satellite in 2012. The VIIRS satellite represented multiple improvements over DMSP.
DMSP and VIIRS datasets are both available through NOAA. We used both image sources to reconstruct nightlight trends and measure changes between 2000 and 2017 in the lowlands of Ethiopia. We used the annual DMSP data for the years 2000 to 2013, and monthly VIIRs data for the years 2012 to 2017 (DSMP does not provide monthly datasets). Due to the unavailability of VIIRS prior to 2012 and DMSP after 2013, we developed a semi-automated workflow to composite and inter-calibrate the VIIRS and DMPS images into a homogeneous annual dataset covering 2000 to 2017.
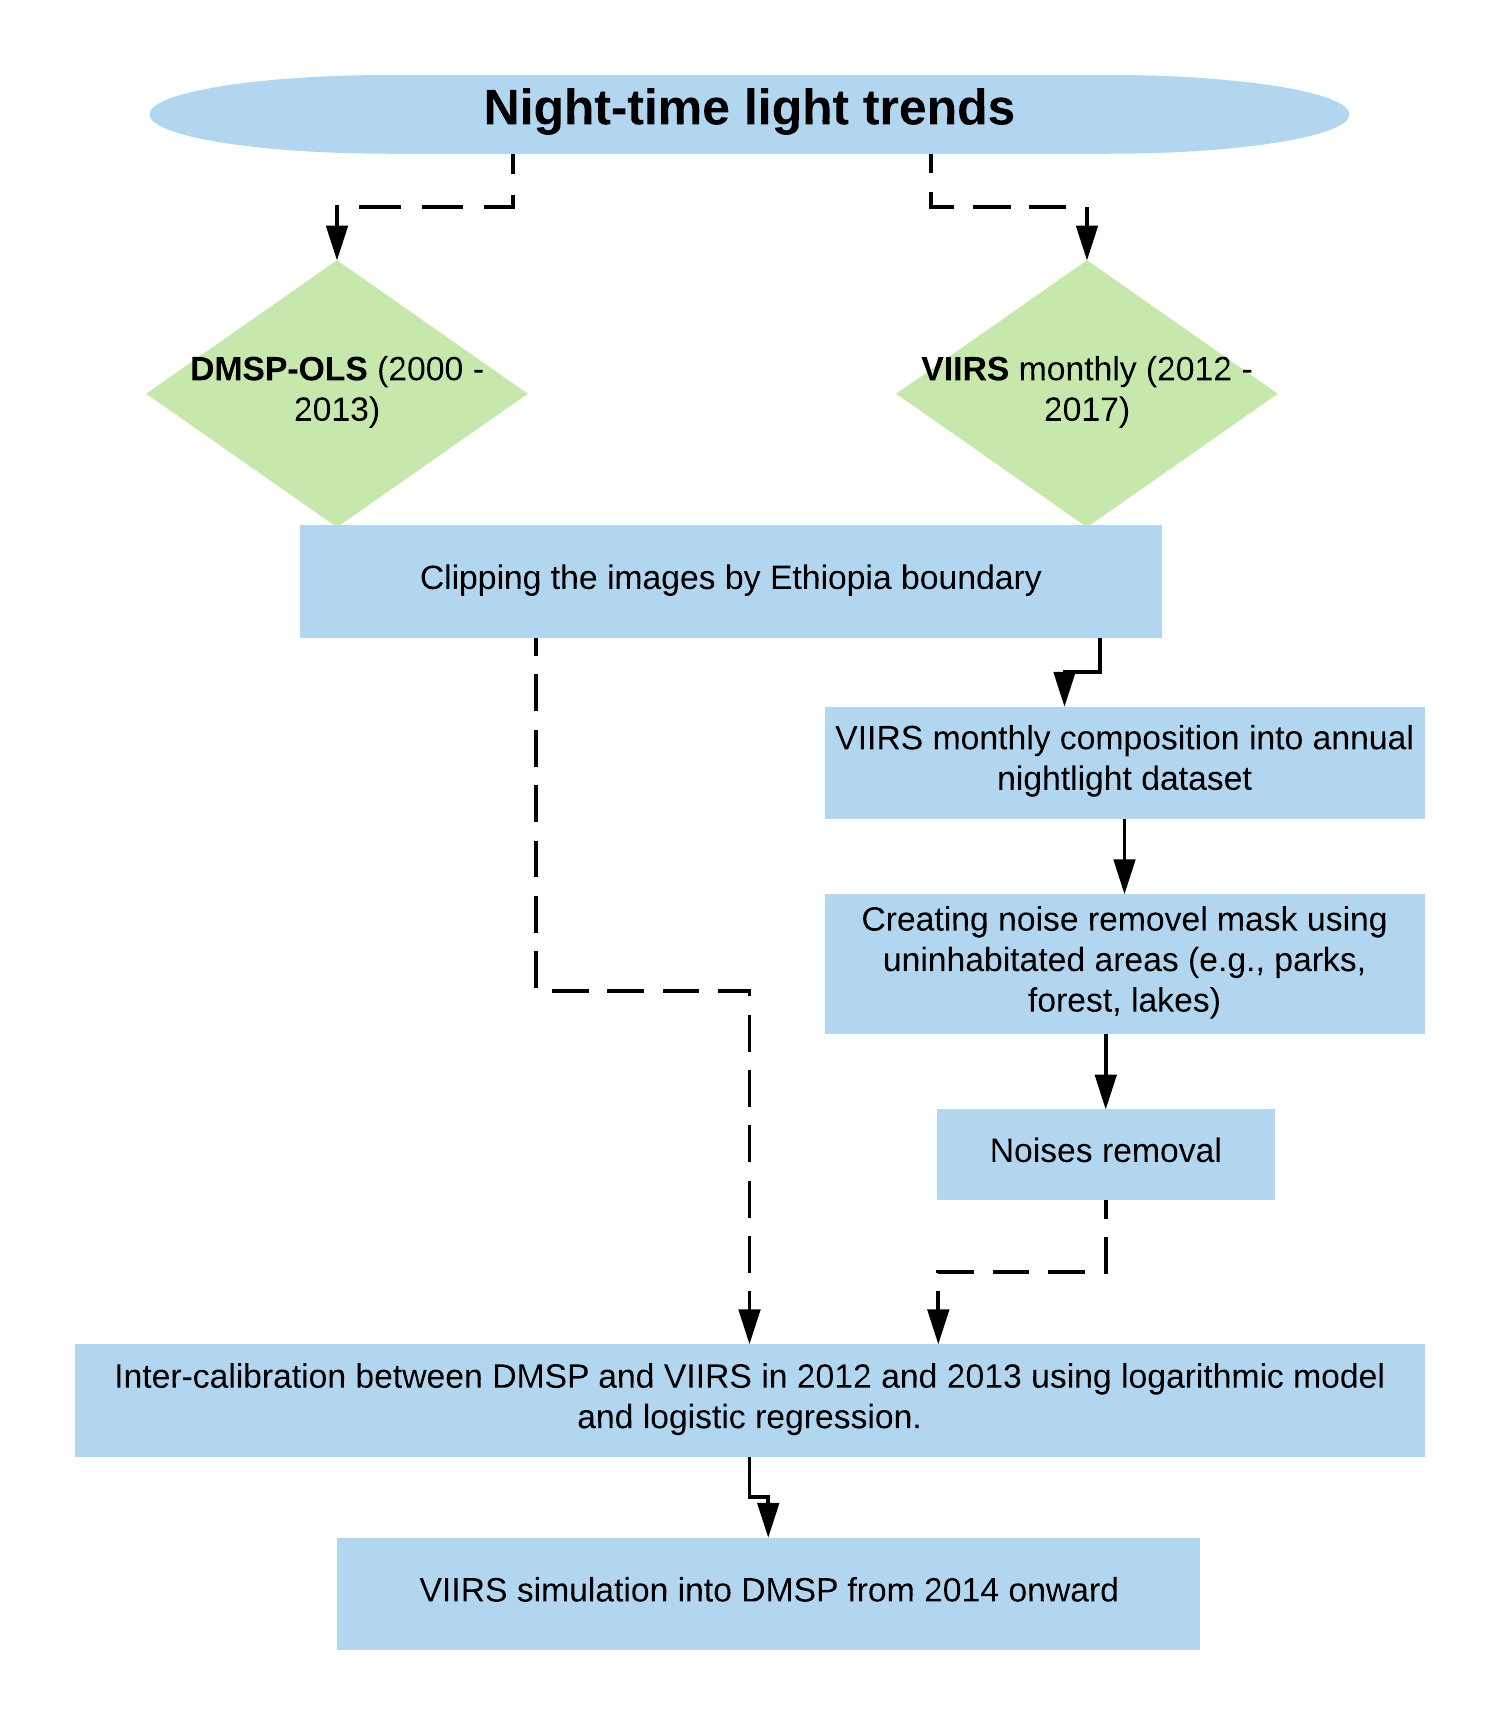
The following flowchart shows our workflow for reconstructing historical nightlight trends in Ethiopia:
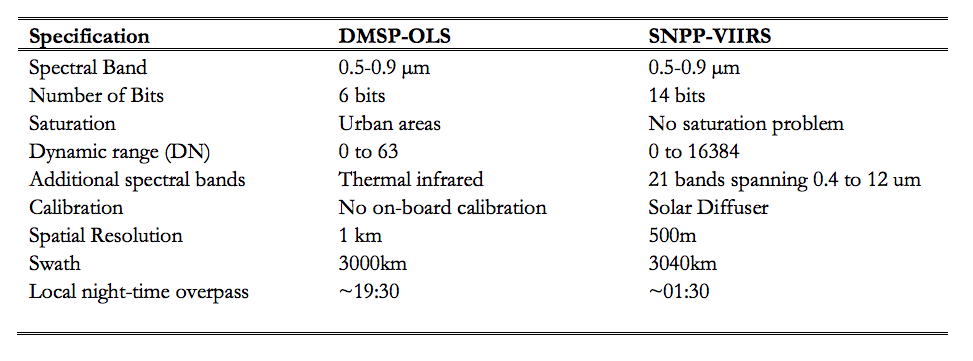
Differences between DMSP and VIIRS
DMSP and VIIRS nightlight data are useful predictors of human population density and electricity usage, as nightlight intensity is a strong indicator of the degree of urbanization, and consequently a proxy for population density. However, the two nightlight imagery sources are very different in terms of their spectral bands, data dynamic range (DN), spatial resolution and local night-time overpass.
Historical nightlight trends reconstruction
We developed the following workflow to reconstruct historical nightlight trends between 2000 and 2017 using DMSP-OLS and VIIRS imagery:
Step 1. Clipping and harmonization of DMSP and VIIRS datasets for Ethiopia
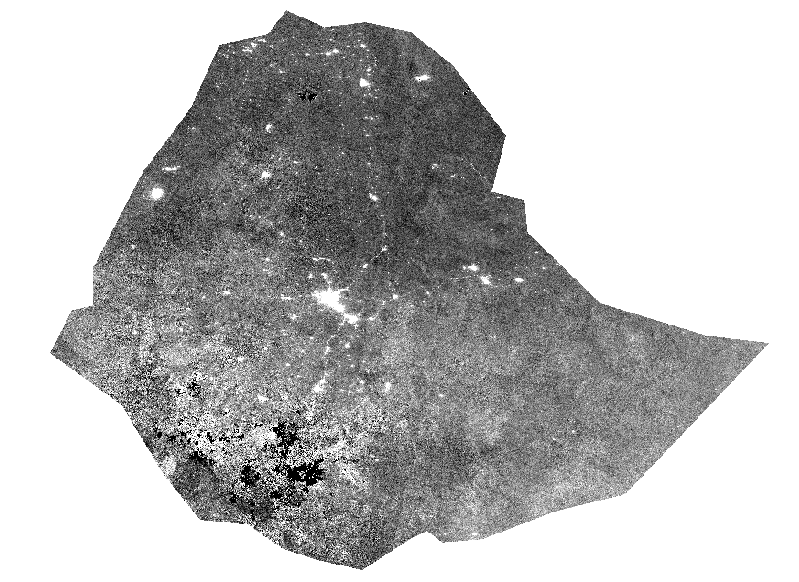
Because DSMP data are only available at the yearly level, we aggregated the VIIRS monthly imagery into annual datasets. VIIRS monthly imagery is generally noisy (see the image below). To reduce noise in the VIIRS scenes, we sampled illumination values from pixels visibly far from urban areas, e.g. large water bodies or vegetated areas in remote national parks computed the average illumination value from the sampled pixels, and subtracted the average non-urban illumination value from the full scene.
Step 2. Inter-calibration between DMSP and VIIRS
In order to construct a consistent time-series of nightlight data using both image sources, we fit a logarithmic model predicting VIIRS illumination as a function of DMSP illumination using data from the overlapping two years of overlapping data (2012 and 2013) from the two sources. Using this model, we predicted DMSP values for all years in the VIIRS dataset.
Step 3. Reconstruction of the nightlight trends
After nightlight inter-calibration, annual VIIRS images for Ethiopia from 2014 can be degraded to the level of DMSP. We then harmonized both datasets temporally, spatially and radiometrically, in order to allow for the reconstruction of historical nightlight trends from 2000-2017.