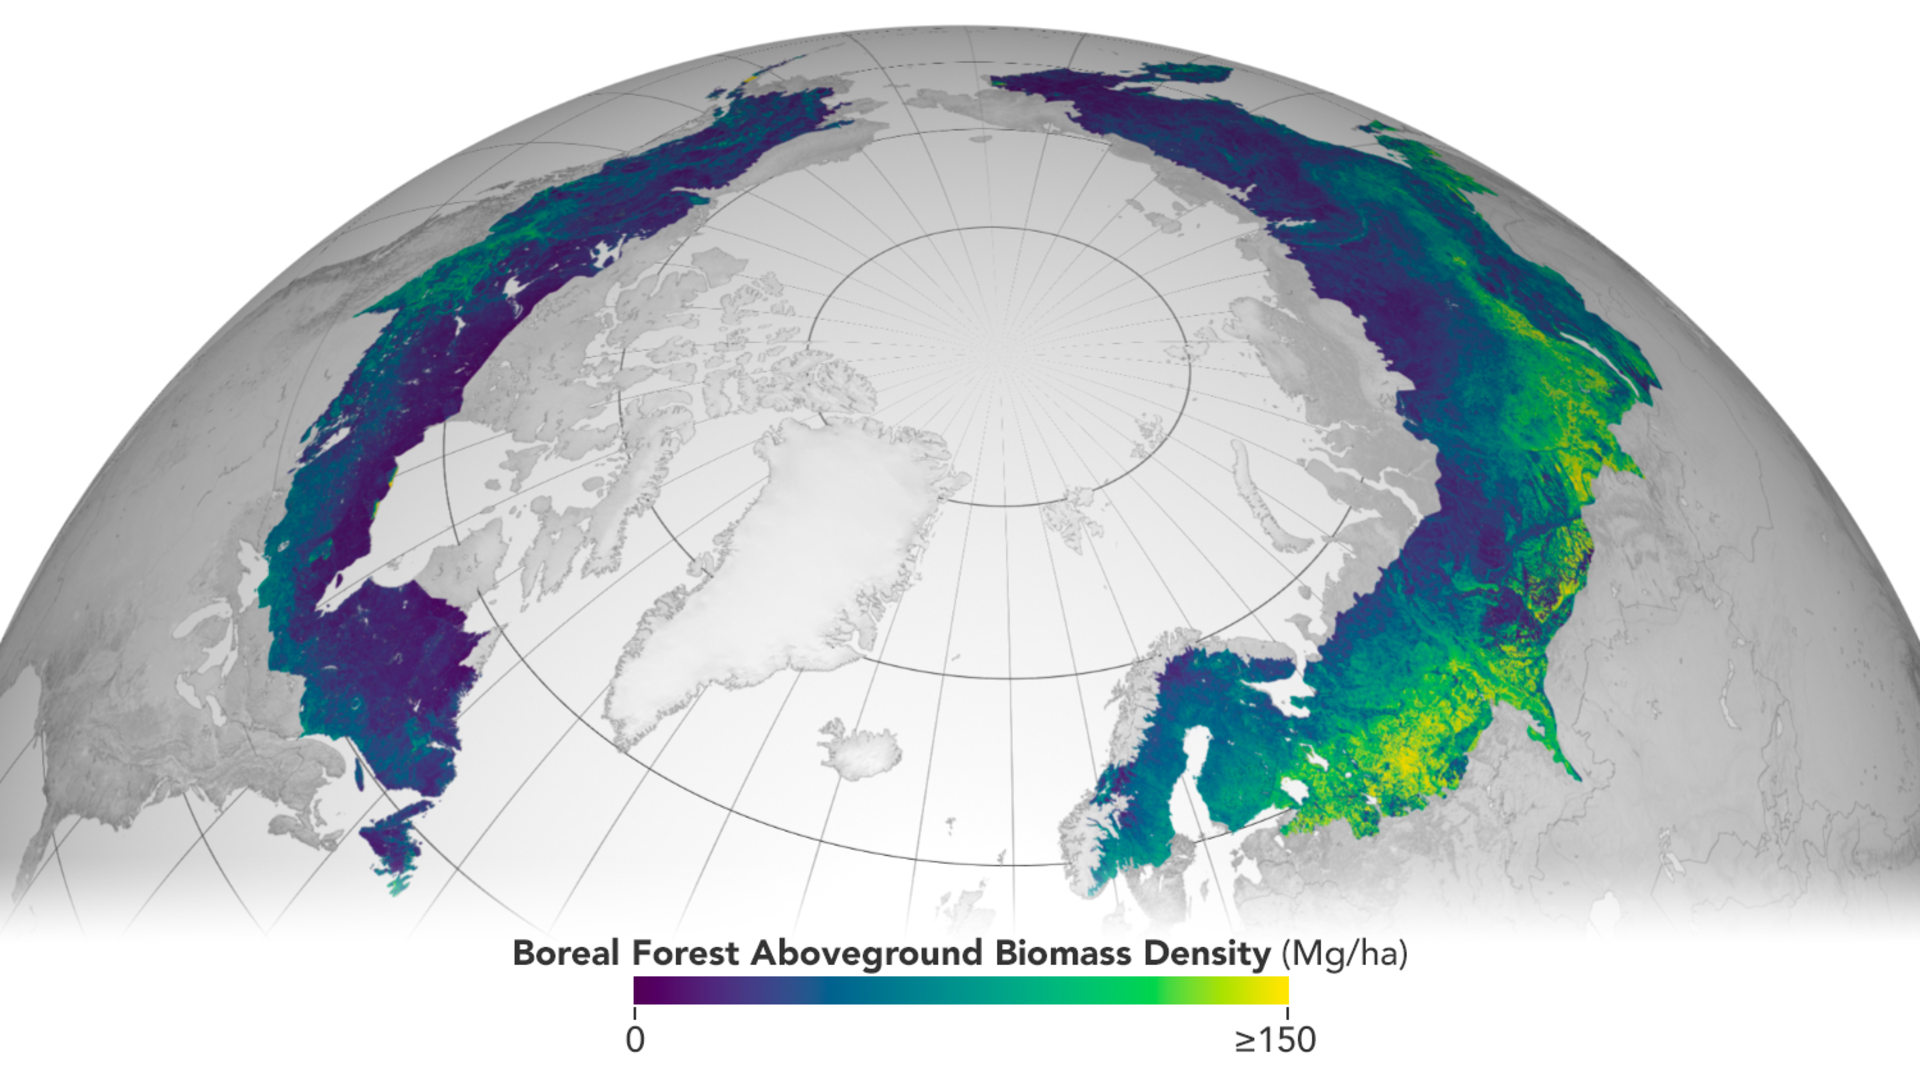
Tile rendering time has a big impact on the user experience so the goal is to minimize the time it takes to properly render tiles. This report contains a comparison between two systems for serving dynamic tiles from the icesat2-boreal collection.
icesat2-boreal collection

The icesat2-boreal collection is a MAAP dataset contains aboveground biomass predictions for the boreal region. The predictions are stored in cloud-optimized geotiffs (COGs) in AWS S3 storage. The collection can be visualized using dynamic tiling applications like titiler. For more details about the underlying data, check out the product page.
Collection details:
- 30 meter resolution
- ~4900 90x90 km COGs
Tiling service details
We are testing two dynamic tile rendering services that use different methods to construct the list of assets required for each tile. Both services are deployed as serverless functions on AWS in the us-west-2 region and are reading raster data from the same S3 bucket and returning rendered tile images to the client.
titiler-pgstac: /collections/{collection_id}/tiles endpoint
- Queries a
pgstacdatabase to determine which STAC items in theicesat2-borealcollection are required to render an image for an XYZ tile - Requires a Lambda and Postgresql database to be deployed
- Struggles to render tiles at zoom levels 5 and below
- See deployment details in maap-eoapi
titiler: /mosaicjson/{mosaic_id}/tiles endpoint
- Queries a MosaicJSON document in a dynamodb table to get the pre-calculated list of assets required to render an image for an XYZ tile
- Requires a Lambda but does not require a database instance
Tile rendering benchmark comparison
This benchmark simulates map browsing behavior by requesting a viewport of 63 tiles (9×7 grid) centered at -102°W, 57°N. The test makes concurrent requests using async/await to mirror how modern web browsers load map tiles.
Each test includes warmup iterations and multiple rounds to ensure reliable measurements. Results show the total time to load a complete viewport, with success and error counts providing insight into service reliability. Lower response times indicate better perceived performance for end users.
The benchmark results show that titiler-pgstac and mosaicjson methods will return rendered tiles in about the same time regardless of zoom level. The mosaicjson service slightly out-performs the titiler-pgstac service at lower zoom levels, probably because the asset identification for each tile has been pre-computed in the mosaicjson document.
Map browsing comparison
Try browsing a map with each tile service to get a sense for what the rendering time is for each one. The viewports for the two maps are synchronized and start out at zoom level 6.
titiler-pgstac
mosaicjson
No tiles will be rendered if you zoom out beyond zoom level 6!