STAC at Scale
GSA GtCoP November 2024: Designing and maintaining STAC infrastructure for large‐scale applications
2024-11-19
Development Seed
- geospatial engineering and product design consultancy
- 20 years of operations with offices in Washington DC, and Lisbon, Portugal. With 54+ staff working across the globe.
STAC refresher
SpatioTemporal Asset Catalog
- STAC spec
- STAC API spec
- community-driven
Vision
The goal is for all providers of spatiotemporal assets (Imagery, SAR, Point Clouds, Data Cubes, Full Motion Video, etc) to expose their data as SpatioTemporal Asset Catalogs (STAC), so that new code doesn’t need to be written whenever a new data set or API is released.
- Data providers don’t need to write new APIs
- Data consumers don’t need to learn new APIs
- Tool builders don’t need to build against new APIs
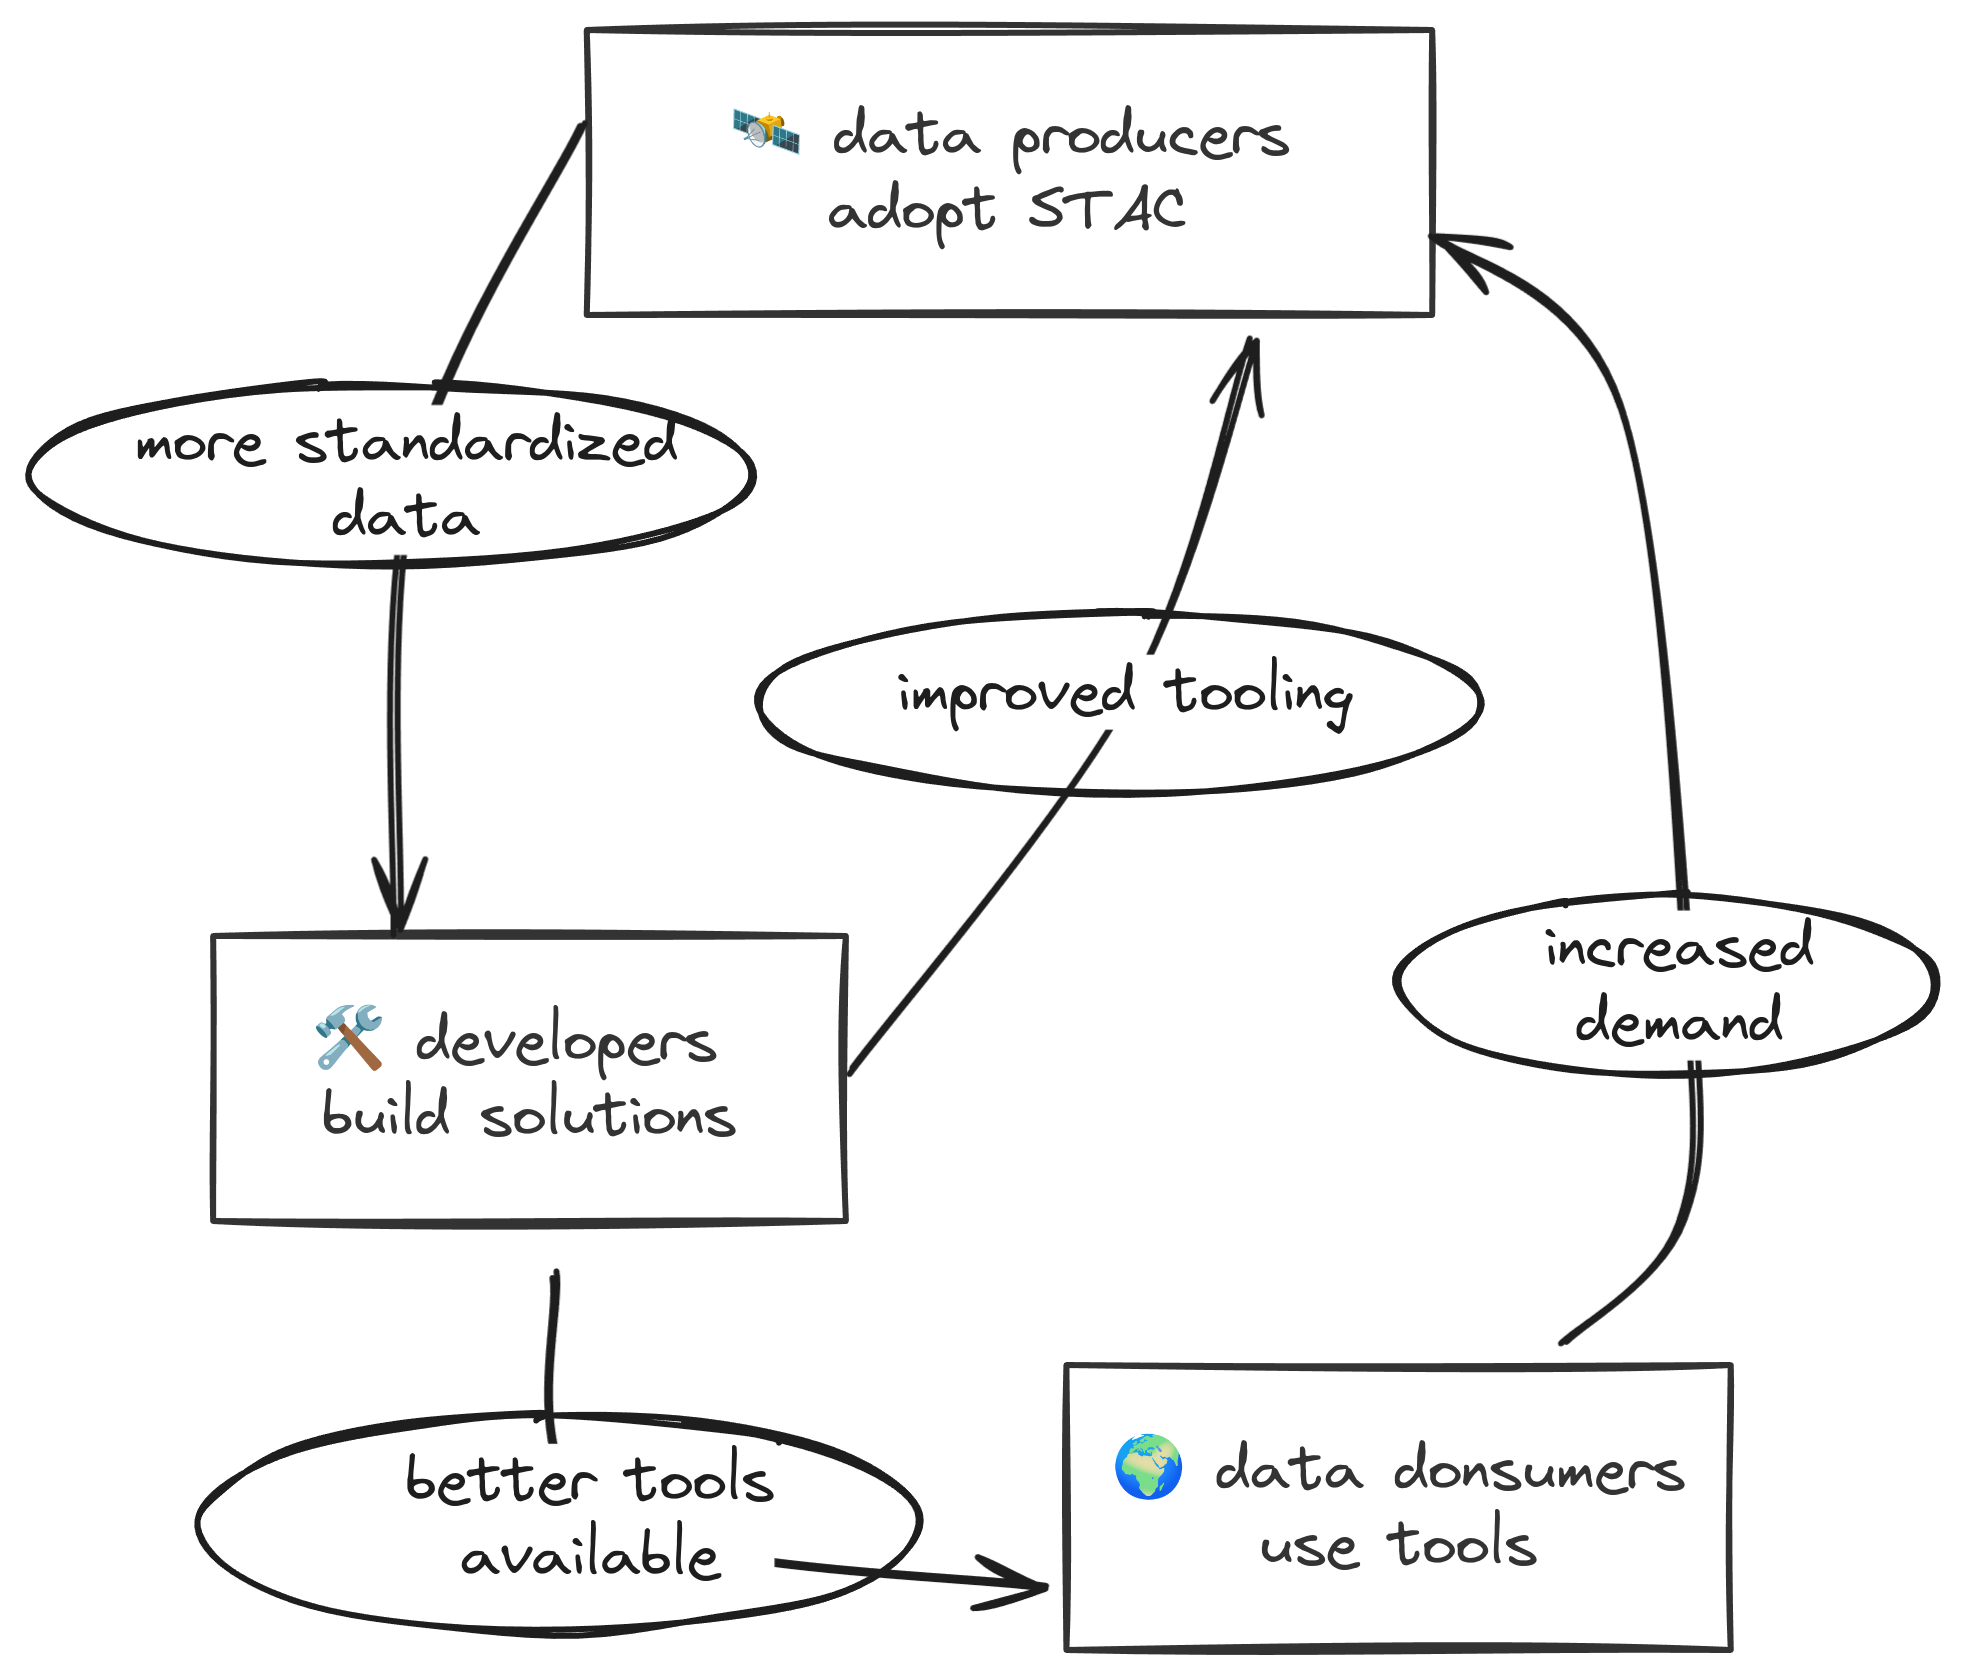
How is it going?
- Providers: producing STAC metadata and hosting STAC APIs
- Developers: building awesome applications
- Consumers: pushing the limits of APIs and STAC spec
- Community: updating the STAC spec to meet needs of providers, consumers, and developers
The STAC advantage: producers
Benefits for data producers
- Standardized metadata
- no need to invent custom schemas
- use existing validation tools
- re-use or create extensions for specialized needs
- Flexible implementation
- multiple database backends
Reduced development overhead
- community-backed tools
- metadata generation (stactools)
- API implementations (stac-fastapi)
- validation (stac-validator)
- community benefits
- shared development costs
- battle-tested implementations
- active ecosystem growth
The STAC advantage: developers
Benefits for developers
- collaboration among many organizations
- iteratively improve existing tools rather than building from scratch every time
- dig into details of the spec to support as many use-cases as possible
- re-use tested components!
STAC Browser
{
  "collections": [
    {
      "id": "sentinel1-grd",
      "type": "Collection",
      "links": [
        {
          "rel": "items",
          "type": "application/geo+json",
          "href": "https://dev.asdi-catalog.org/collections/sentinel1-grd/items"
        },
        {
          "rel": "parent",
          "type": "application/json",
          "href": "https://dev.asdi-catalog.org/"
        }
      ],
      "title": "Sentinel-1 GRD",
      "extent": {
        "spatial": {
          "bbox": [
            [-180, -90, 180, 90]
          ]
        },
        "temporal": {
          "interval": [
            [
              "2014-10-10T00:00:00Z",
              null
            ]
          ]
        }
      }
    }
  ]
}Explore STAC Browser
Maxar imagery from Maui wildfires in August 2023
STAC at scale: a journey
Outline
LandsatLook
- user-facing USGS application for visualizaing mosaics of Landsat scenes
Microsoft Planetary Computer
- massive geospatial data catalog
- dynamic visualization capabilities
Amazon Sustainability Data Initiative
- public science data
- event-driven STAC metadata generation pipelines
LandsatLook
- an early STAC-powered application
- interactive Landsat imagery browser
- spurred the development of MosaicJSON
- inspired the next generation of database backends
Explore LandsatLook
MosaicJSON
- pre-compute which STAC items are required for each XYZ tile
- based on search criteria and item spatial extents
- makes dynamic mosaic visualizations possible!
- reduces burden on STAC API, but costly to create

Microsoft Planetary Computer
- built on open standards
- STAC API with many public datasets
- continuous flow of new data
- interactive visualization platform powered by STAC metadata
Explore Planetary Computer
pgstac origin story
How can we optimize for lightning fast queries?
pgstac was born 
pgstac
PostgreSQL schema and functions for Spatio-Temporal Asset Catalog (STAC)
strengths
- it’s Postgres!
- built to handle hundreds of millions of items
- optimized for “needle in haystack” queries
- hashed searches
weaknesses
- requires some tinkering to achieve optimal performance
- aggregation statistics can be somewhat slow
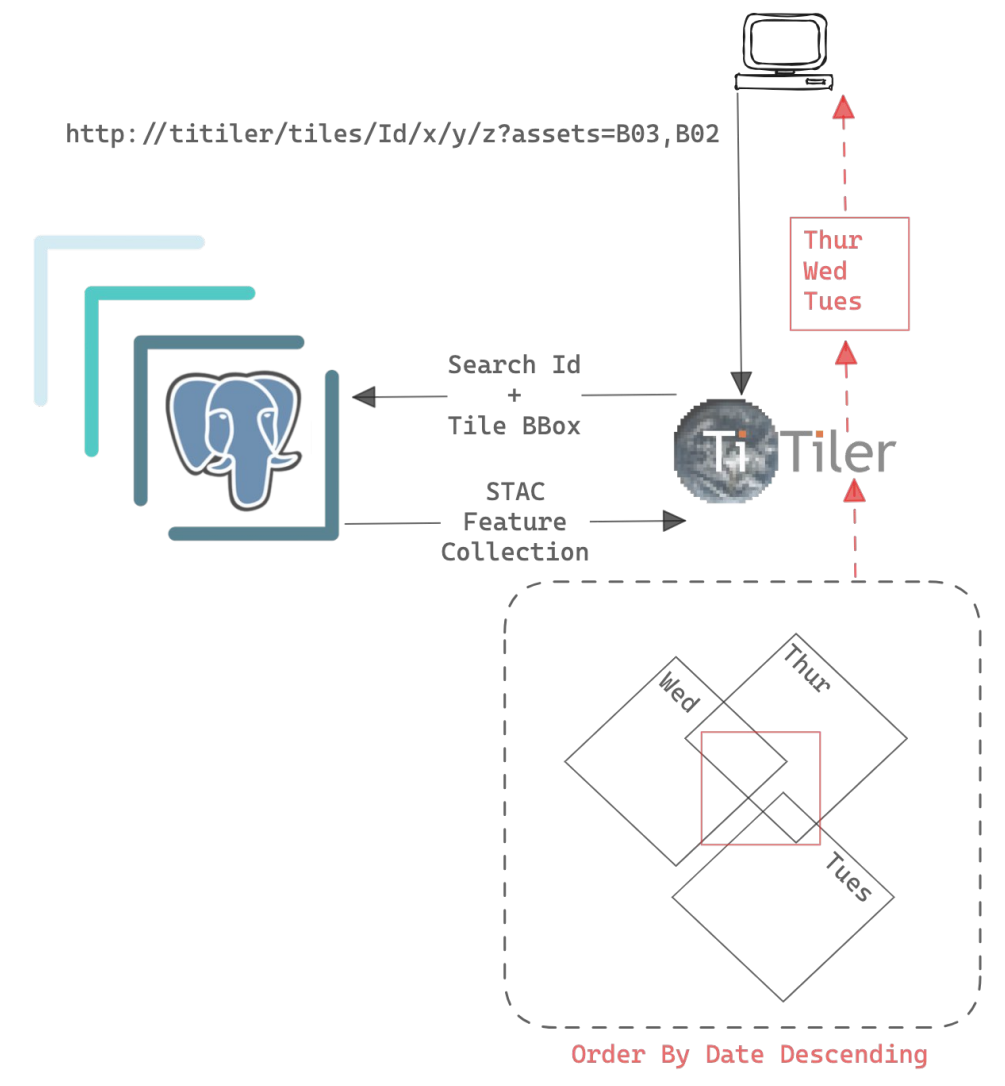
titiler-pgstac
- dynamic mosaic visualizations from STAC collections
- connects directly to
pgstacdatabase- (no API requests for STAC queries)
- hashed searches!
![]()
Integrated mosaic tiling
Amazon Sustainability Data Initiative (ASDI)
- sustainability data situated next to a compute platform
- continuously updated
- NODD: partnership with NOAA
ASDI Catalog
stactools-packages
The stactools-packages github organization is a home for datasets and tool packages using the SpatioTemporal Asset Catalog (STAC) specification.
- user-generated STAC metadata building packages
href-> STAC item
Browse stacktools-packages
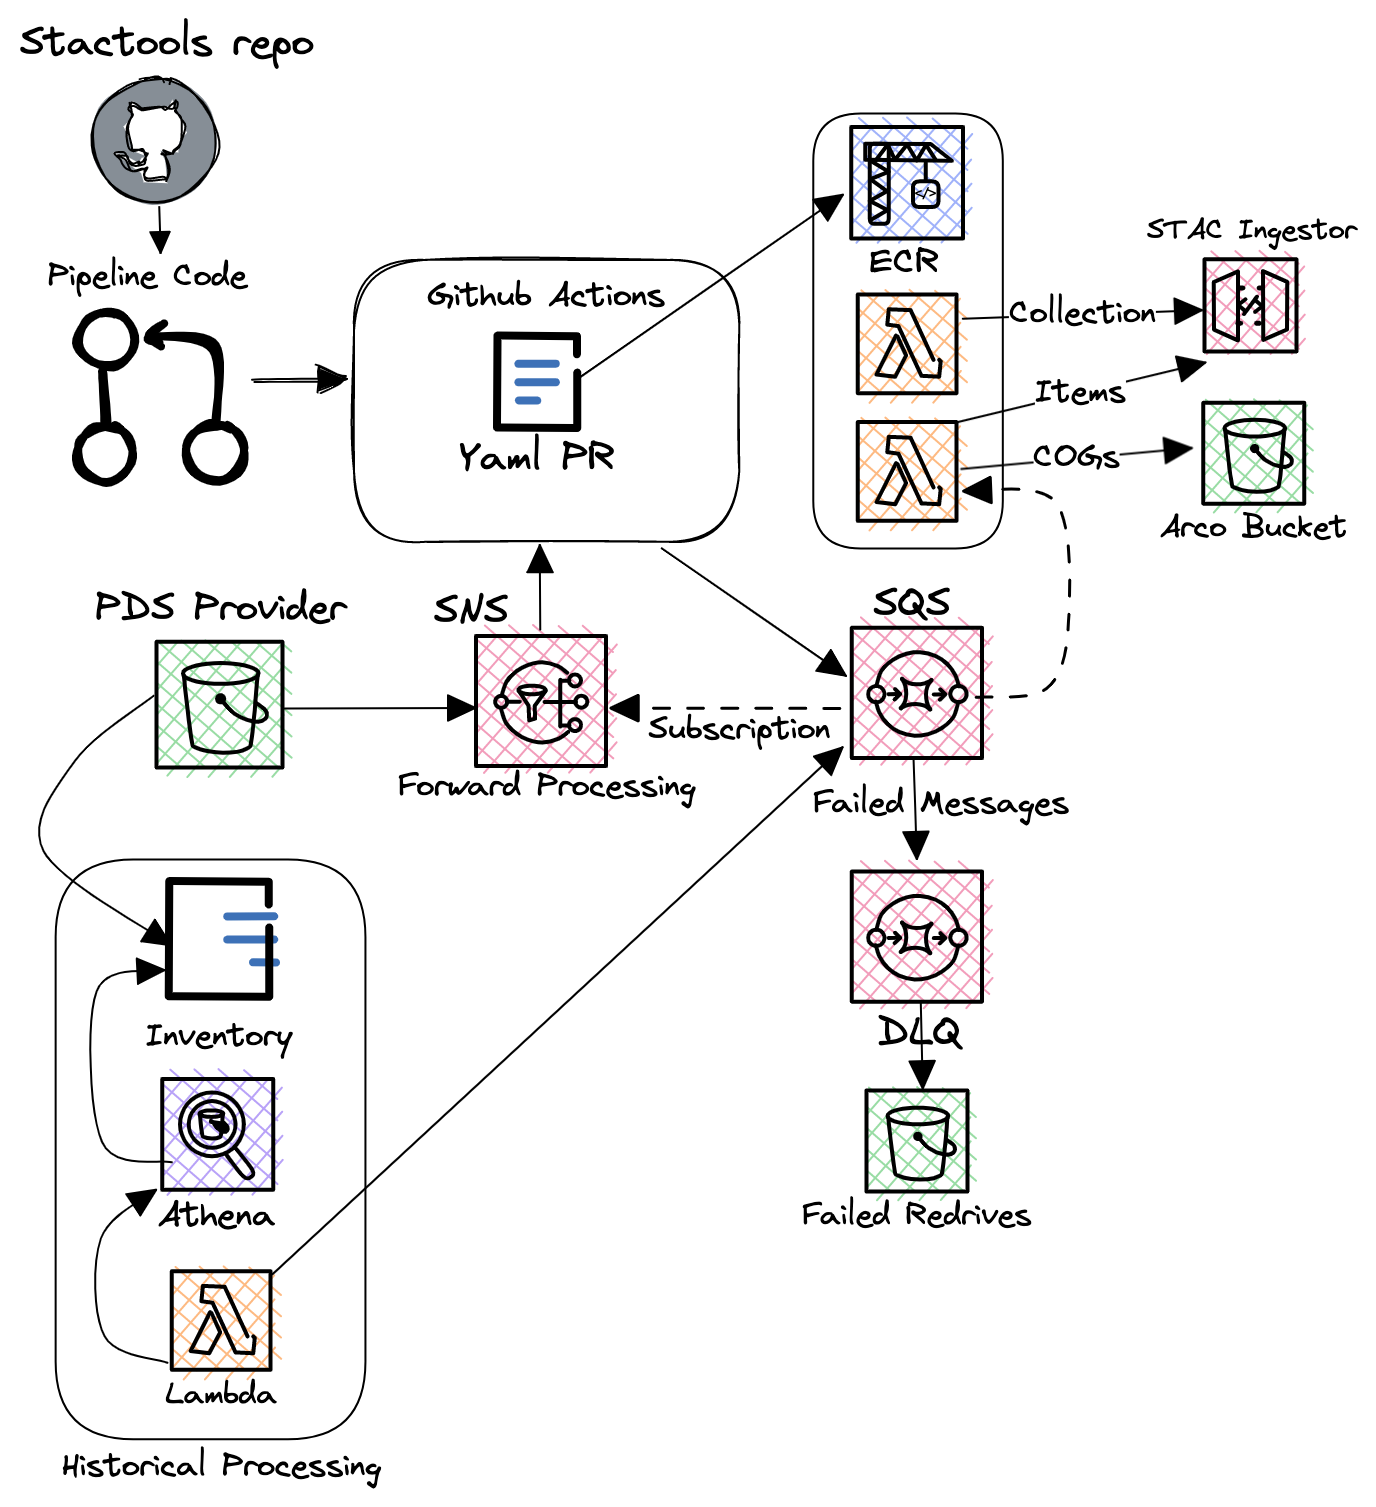
stactools-pipelines
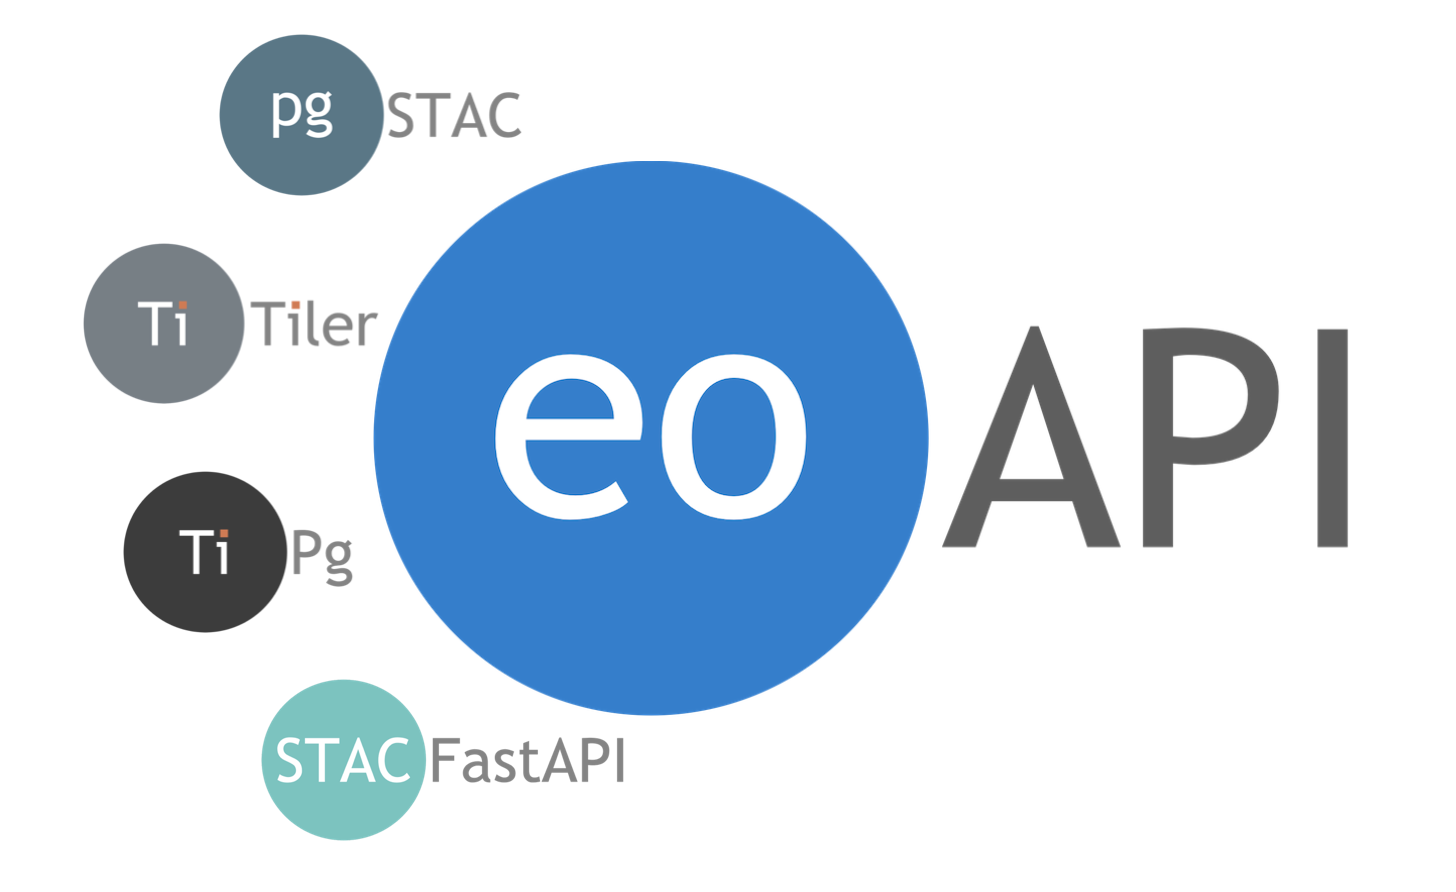
eoAPI
State-of-the-art services to enable data discovery, search, visualization, and access.
The STAC advantage: consumers
- don’t need to learn file path schema for a new dataset (don’t need to even think about file ops)
- can rely on tools like
pystac_clientfor API operations andodc_stacfor file i/o
Example workflow
- thanks to the STAC spec we only need a few libraries to interact with data from any collection!
Define AOI
- set up an AOI
crs = pyproj.CRS.from_string("epsg:5070")

# bounding box that surrounds the North Shore of Lake Superior
bbox = (373926, 2744693, 406338, 2765304)
aoi = box(*bbox)

# STAC items **always** store bounding box info in epsg:4326
transformer_4326 = pyproj.Transformer.from_crs(
    crs_from=crs,
    crs_to="epsg:4326",
    always_xy=True,
)

bbox_4326 = transform(transformer_4326.transform, aoi).bounds
print(bbox_4326)
(-91.05816506751593, 47.592675062538454, -90.61526491213358, 47.79503898873347)Collection search
- find DEM collections in a STAC API
client = pystac_client.Client.open(
    "https://dev.asdi-catalog.org/"
)

collection_search = client.collection_search(q="DEM", bbox=bbox_4326)
search_results = {
    collection.id: collection
    for collection in collection_search.collections()
}

for collection_id, collection in search_results.items():
    print(f"{collection_id}: {collection.description}\n")
cop-dem-glo-30: The Copernicus DEM is a Digital Surface Model (DSM) which represents the surface of the Earth including buildings, infrastructure and vegetation. We provide two instances of Copernicus DEM named GLO-30 Public and GLO-90. GLO-90 provides worldwide coverage at 90 meters. GLO-30 Public provides limited worldwide coverage at 30 meters because a small subset of tiles covering specific countries are not yet released to the public by the Copernicus Programme. Note that in both cases ocean areas do not have tiles, there one can assume height values equal to zero. Data is provided as Cloud Optimized GeoTIFFs and comes from Copernicus DEM 2021 release.
Item search
- query STAC items
- type "FeatureCollection"
features[] 2 items
0
- type "Feature"
- stac_version "1.0.0"
stac_extensions[] 1 items
- 0 "https://stac-extensions.github.io/projection/v1.1.0/schema.json"
- id "Copernicus_DSM_COG_10_N47_00_W092_00_DEM"
geometry
- type "Polygon"
coordinates[] 1 items
0[] 5 items
0[] 2 items
- 0 -91.00013888888888
- 1 47.00013888888889
1[] 2 items
- 0 -91.00013888888888
- 1 48.00013888888889
2[] 2 items
- 0 -92.00013888888888
- 1 48.00013888888889
3[] 2 items
- 0 -92.00013888888888
- 1 47.00013888888889
4[] 2 items
- 0 -91.00013888888888
- 1 47.00013888888889
bbox[] 4 items
- 0 -92.00013888888888
- 1 47.00013888888889
- 2 -91.00013888888888
- 3 48.00013888888889
properties
- gsd 30.0
- license "proprietary"
- datetime "2021-04-22T00:00:00Z"
- platform "TanDEM-X"
- proj:epsg 4326
providers[] 3 items
0
- url "https://spacedata.copernicus.eu/documents/20126/0/CSCDA_ESA_Mission-specific+Annex.pdf"
- name "European Space Agency"
roles[] 1 items
- 0 "licensor"
1
- url "https://registry.opendata.aws/copernicus-dem/"
- name "Sinergise"
roles[] 2 items
- 0 "producer"
- 1 "processor"
2
- url "https://registry.opendata.aws/copernicus-dem/"
- name "Sinergise"
roles[] 1 items
- 0 "host"
proj:shape[] 2 items
- 0 3600
- 1 3600
proj:transform[] 6 items
- 0 0.0002777777777777778
- 1 0.0
- 2 -92.00013888888888
- 3 0.0
- 4 -0.0002777777777777778
- 5 48.00013888888889
links[] 6 items
0
- rel "collection"
- href "https://dev.asdi-catalog.org/collections/cop-dem-glo-30"
- type "application/json"
1
- rel "parent"
- href "https://dev.asdi-catalog.org/collections/cop-dem-glo-30"
- type "application/json"
2
- rel "root"
- href "https://dev.asdi-catalog.org/"
- type "application/json"
- title "ASDI STAC API (dev)"
3
- rel "self"
- href "https://dev.asdi-catalog.org/collections/cop-dem-glo-30/items/Copernicus_DSM_COG_10_N47_00_W092_00_DEM"
- type "application/geo+json"
4
- rel "handbook"
- href "https://object.cloud.sdsc.edu/v1/AUTH_opentopography/www/metadata/Copernicus_metadata.pdf"
- type "application/pdf"
- title "Copernicus DEM User handbook"
5
- rel "license"
- href "https://spacedata.copernicus.eu/documents/20126/0/CSCDA_ESA_Mission-specific+Annex.pdf"
- type "Copernicus Data Access"
assets
data
- href "s3://copernicus-dem-30m/Copernicus_DSM_COG_10_N47_00_W092_00_DEM/Copernicus_DSM_COG_10_N47_00_W092_00_DEM.tif"
- type "image/tiff; application=geotiff; profile=cloud-optimized"
- title "N47_00_W092_00"
raster:bands[] 1 items
0
- unit "meter"
- sampling "point"
- data_type "float32"
- spatial_resolution 30
roles[] 1 items
- 0 "data"
- collection "cop-dem-glo-30"
1
- type "Feature"
- stac_version "1.0.0"
stac_extensions[] 1 items
- 0 "https://stac-extensions.github.io/projection/v1.1.0/schema.json"
- id "Copernicus_DSM_COG_10_N47_00_W091_00_DEM"
geometry
- type "Polygon"
coordinates[] 1 items
0[] 5 items
0[] 2 items
- 0 -90.00013888888888
- 1 47.00013888888889
1[] 2 items
- 0 -90.00013888888888
- 1 48.00013888888889
2[] 2 items
- 0 -91.00013888888888
- 1 48.00013888888889
3[] 2 items
- 0 -91.00013888888888
- 1 47.00013888888889
4[] 2 items
- 0 -90.00013888888888
- 1 47.00013888888889
bbox[] 4 items
- 0 -91.00013888888888
- 1 47.00013888888889
- 2 -90.00013888888888
- 3 48.00013888888889
properties
- gsd 30.0
- license "proprietary"
- datetime "2021-04-22T00:00:00Z"
- platform "TanDEM-X"
- proj:epsg 4326
providers[] 3 items
0
- url "https://spacedata.copernicus.eu/documents/20126/0/CSCDA_ESA_Mission-specific+Annex.pdf"
- name "European Space Agency"
roles[] 1 items
- 0 "licensor"
1
- url "https://registry.opendata.aws/copernicus-dem/"
- name "Sinergise"
roles[] 2 items
- 0 "producer"
- 1 "processor"
2
- url "https://registry.opendata.aws/copernicus-dem/"
- name "Sinergise"
roles[] 1 items
- 0 "host"
proj:shape[] 2 items
- 0 3600
- 1 3600
proj:transform[] 6 items
- 0 0.0002777777777777778
- 1 0.0
- 2 -91.00013888888888
- 3 0.0
- 4 -0.0002777777777777778
- 5 48.00013888888889
links[] 6 items
0
- rel "collection"
- href "https://dev.asdi-catalog.org/collections/cop-dem-glo-30"
- type "application/json"
1
- rel "parent"
- href "https://dev.asdi-catalog.org/collections/cop-dem-glo-30"
- type "application/json"
2
- rel "root"
- href "https://dev.asdi-catalog.org/"
- type "application/json"
- title "ASDI STAC API (dev)"
3
- rel "self"
- href "https://dev.asdi-catalog.org/collections/cop-dem-glo-30/items/Copernicus_DSM_COG_10_N47_00_W091_00_DEM"
- type "application/geo+json"
4
- rel "handbook"
- href "https://object.cloud.sdsc.edu/v1/AUTH_opentopography/www/metadata/Copernicus_metadata.pdf"
- type "application/pdf"
- title "Copernicus DEM User handbook"
5
- rel "license"
- href "https://spacedata.copernicus.eu/documents/20126/0/CSCDA_ESA_Mission-specific+Annex.pdf"
- type "Copernicus Data Access"
assets
data
- href "s3://copernicus-dem-30m/Copernicus_DSM_COG_10_N47_00_W091_00_DEM/Copernicus_DSM_COG_10_N47_00_W091_00_DEM.tif"
- type "image/tiff; application=geotiff; profile=cloud-optimized"
- title "N47_00_W091_00"
raster:bands[] 1 items
0
- unit "meter"
- sampling "point"
- data_type "float32"
- spatial_resolution 30
roles[] 1 items
- 0 "data"
- collection "cop-dem-glo-30"
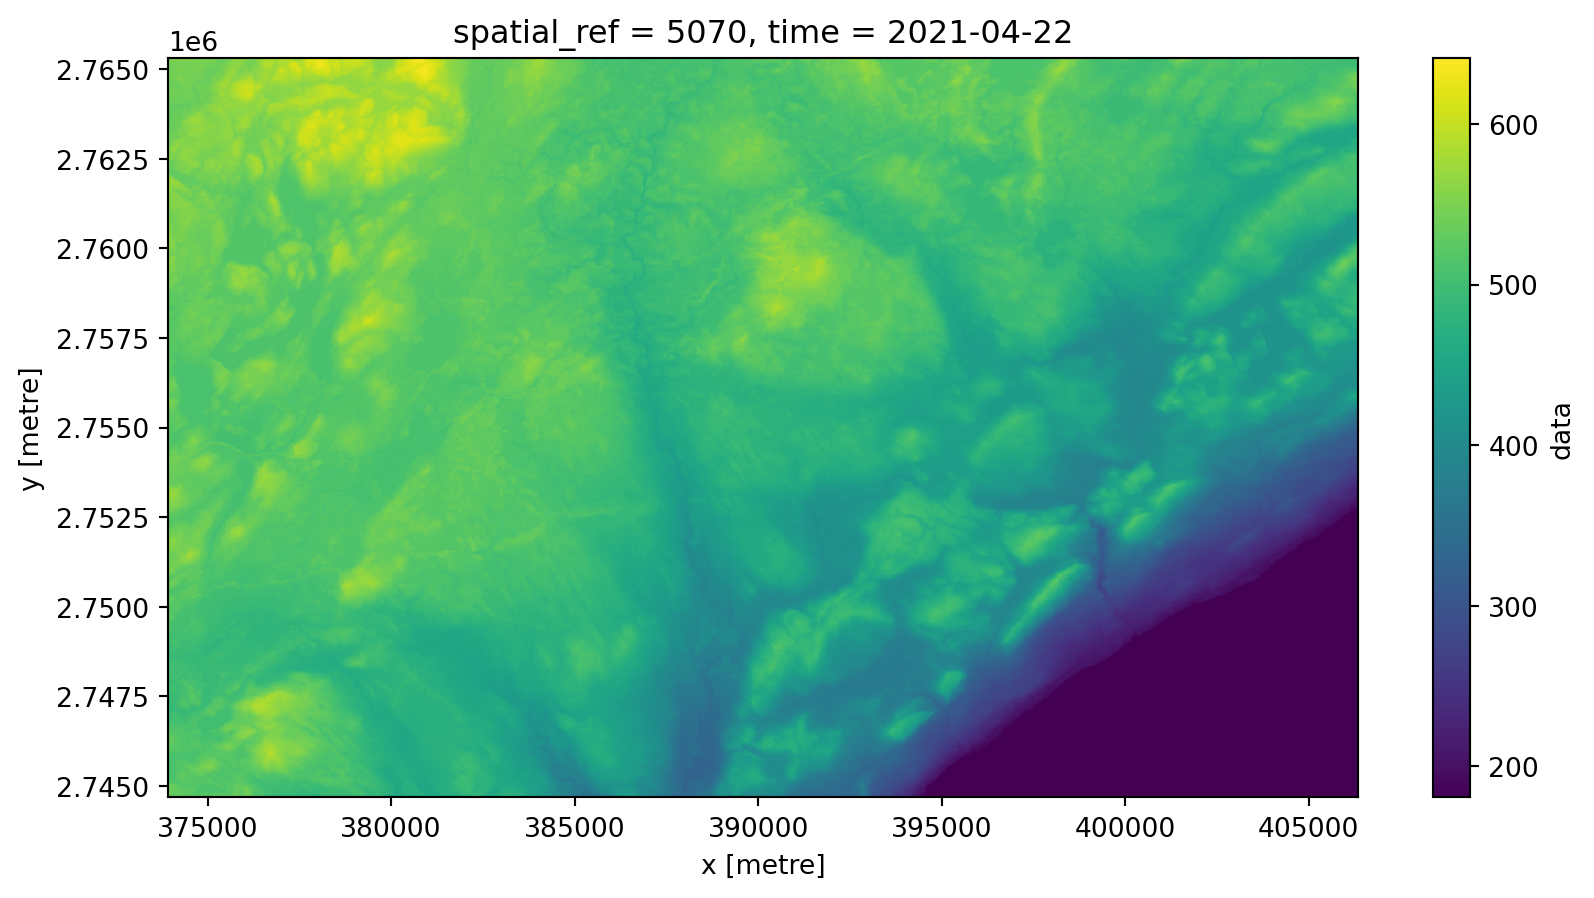
odc.stac.load
- load into an
xarray.Datasetwithodc.stac.load - don’t read any data yet, though (just metadata!)
<xarray.Dataset> Size: 3MB
Dimensions:      (y: 688, x: 1081, time: 1)
Coordinates:
  * y            (y) float64 6kB 2.765e+06 2.765e+06 ... 2.745e+06 2.745e+06
  * x            (x) float64 9kB 3.739e+05 3.74e+05 ... 4.063e+05 4.063e+05
    spatial_ref  int32 4B 5070
  * time         (time) datetime64[ns] 8B 2021-04-22
Data variables:
    data         (time, y, x) float32 3MB dask.array<chunksize=(1, 688, 1081), meta=np.ndarray>
xarray API
- access to the
xarrayAPI for visualization and analysis - read data from cloud storage “just-in-time”
New source, same tools
- read another dataset from a different source
client = pystac_client.Client.open(
    "https://services.terrascope.be/stac"
)

# sometimes necessary before running a collection search
client.add_conforms_to("COLLECTIONS")
collection_search = client.collection_search(
    q="WorldCover", bbox=bbox_4326
)

stac_items = client.search(
    collections=next(collection_search.collections()).id,
    bbox=bbox_4326,
).item_collection()
Load land cover
<xarray.Dataset> Size: 758kB
Dimensions:                 (y: 688, x: 1081, time: 1)
Coordinates:
  * y                       (y) float64 6kB 2.765e+06 2.765e+06 ... 2.745e+06
  * x                       (x) float64 9kB 3.739e+05 3.74e+05 ... 4.063e+05
    spatial_ref             int32 4B 5070
  * time                    (time) datetime64[ns] 8B 2020-12-31T23:59:59
Data variables:
    ESA_WORLDCOVER_10M_MAP  (time, y, x) uint8 744kB dask.array<chunksize=(1, 688, 1081), meta=np.ndarray>
Merge datasets
- combine the two Datasets into a single
xarray.Dataset
<xarray.Dataset> Size: 4MB
Dimensions:      (y: 688, x: 1081)
Coordinates:
  * y            (y) float64 6kB 2.765e+06 2.765e+06 ... 2.745e+06 2.745e+06
  * x            (x) float64 9kB 3.739e+05 3.74e+05 ... 4.063e+05 4.063e+05
    spatial_ref  int32 4B 5070
    time         datetime64[ns] 8B 2020-12-31T23:59:59
Data variables:
    land_cover   (y, x) uint8 744kB dask.array<chunksize=(688, 1081), meta=np.ndarray>
    elevation_m  (y, x) float32 3MB dask.array<chunksize=(688, 1081), meta=np.ndarray>
Analyze disparate datasets
- calculate mean elevation by land cover class
Closing thoughts
- STAC is working on a very large scale already
- adoption by large organizations has been a huge accelerator
- more STAC, please